
Our Programs
Apply Now

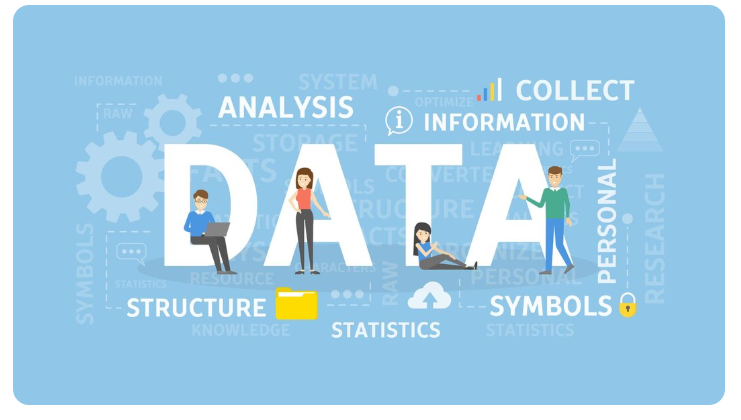
Data Interpretation is the process of examining and explaining collected data to identify meaningful patterns, trends, relationships, and conclusions. It involves converting numerical or qualitative information into useful insights that can support decision-making. Data interpretation is commonly used in research, business analytics, academics, healthcare, and competitive examinations.
Data Interpretation involves making sense of information collected through surveys, experiments, observations, databases, or other research methods. It typically requires examining tables, charts, graphs, numerical results, or qualitative findings to understand what the data indicates. Effective interpretation goes beyond simply describing numbers; it explains their significance and connects findings to the original research question or objective.
The interpretation of research data is particularly important because researchers use it to draw conclusions and evaluate whether their findings support a hypothesis. In business and management, data interpretation helps identify market trends, customer behavior, operational patterns, and opportunities for improvement. Accurate interpretation also requires considering limitations, context, and potential sources of bias.
Example:
A company analyzes monthly sales data and finds that sales increased consistently after launching a digital marketing campaign. Data interpretation would involve examining whether the increase is associated with the campaign and considering other factors that may have influenced sales.
Applications include:







BBA Brochure

PGDM Brochure
MBA Brochure
Executive MBA Brochure





.webp) Call Us